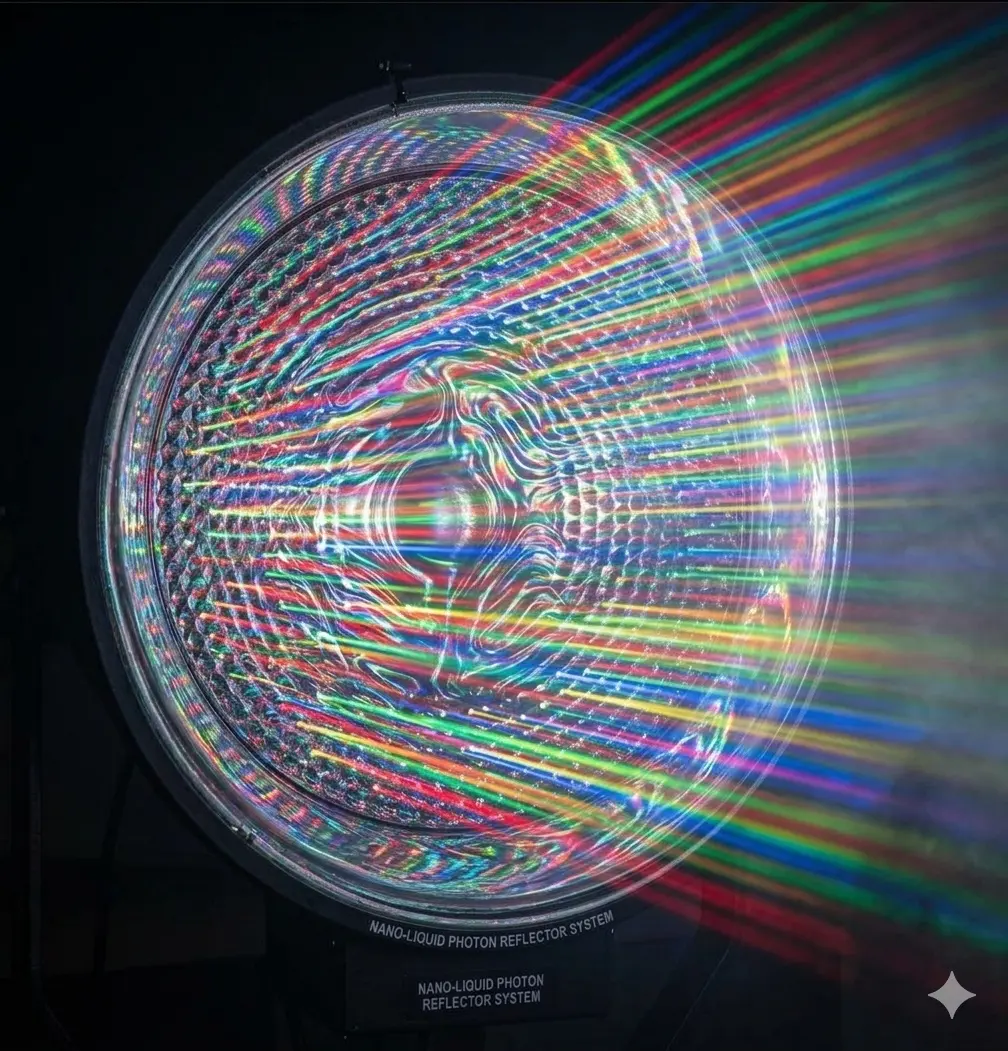
Optical architecture · Technical overview
The Hidden Architecture of Growth™
Every Photon Has a Purpose
Nano Grow Light brings precision optical architecture to horticultural lighting—managing, redirecting, and distributing light with the growing canopy in mind.
At a glance
Evidence summary
- Technology
- Nano Liquid Photonic Coating™
- Instrument set
- Apogee MQ-610Ocean Insight USB4000 · FLIR E6
- Methodology published
- Yes
- Raw data available
- Yes
- Nano cluster size
- 23–79 nm
- Measurement status
- Ongoing validation
- Subject
- Reflector optical architecture
- Application
- Horticultural lighting
Evidence in brief
Key Findings
Manufacturer-reported measurements from internal testing, summarized for quick reference.
- PAR reflectance98.7% measured under internal testing.
- Blue-band reflectance99.2% measured under internal testing.
- Red-band reflectance99.3% measured under internal testing.
- Beam spill reductionApproximately 31% versus an uncoated aluminum reflector.
- Testing instrumentsApogee MQ-610, Ocean Optics USB4000, and FLIR E6.
- Validation statusManufacturer-reported results; third-party validation is pending.
These results are specific to the reported internal test setup. Full test conditions, sample count, uncertainty, and reference configuration are required for independent interpretation.
01 / Optical architecture
Designed to shape the light.
A reflector is more than a bright surface. Its geometry influences where light travels, how it spreads, and how much reaches the plant canopy.

The reflector uses a radial geometry to guide emitted light toward the growing area. Its optical architecture is intended to redirect photons that might otherwise travel outside the useful footprint and distribute illumination across the canopy.
In practical terms, reflector shape, fixture height, orientation, and canopy dimensions work together to determine the light pattern at plant level. Results vary with setup and measurement conditions.
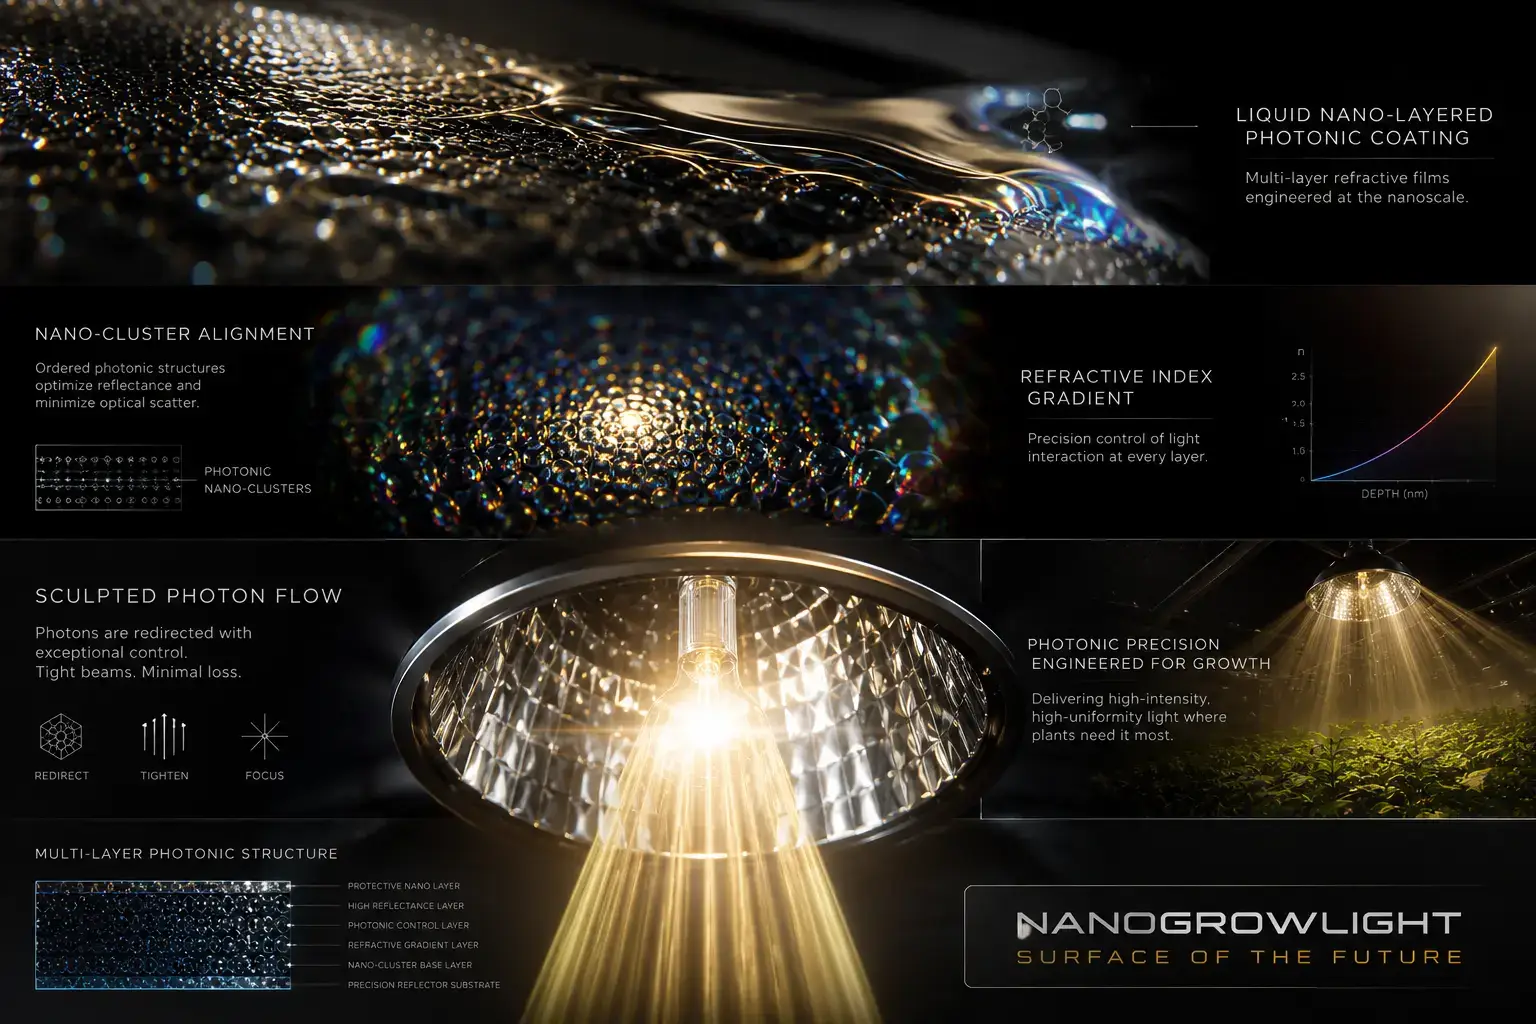
02 / Reflector cell structure
A surface with a job to do.
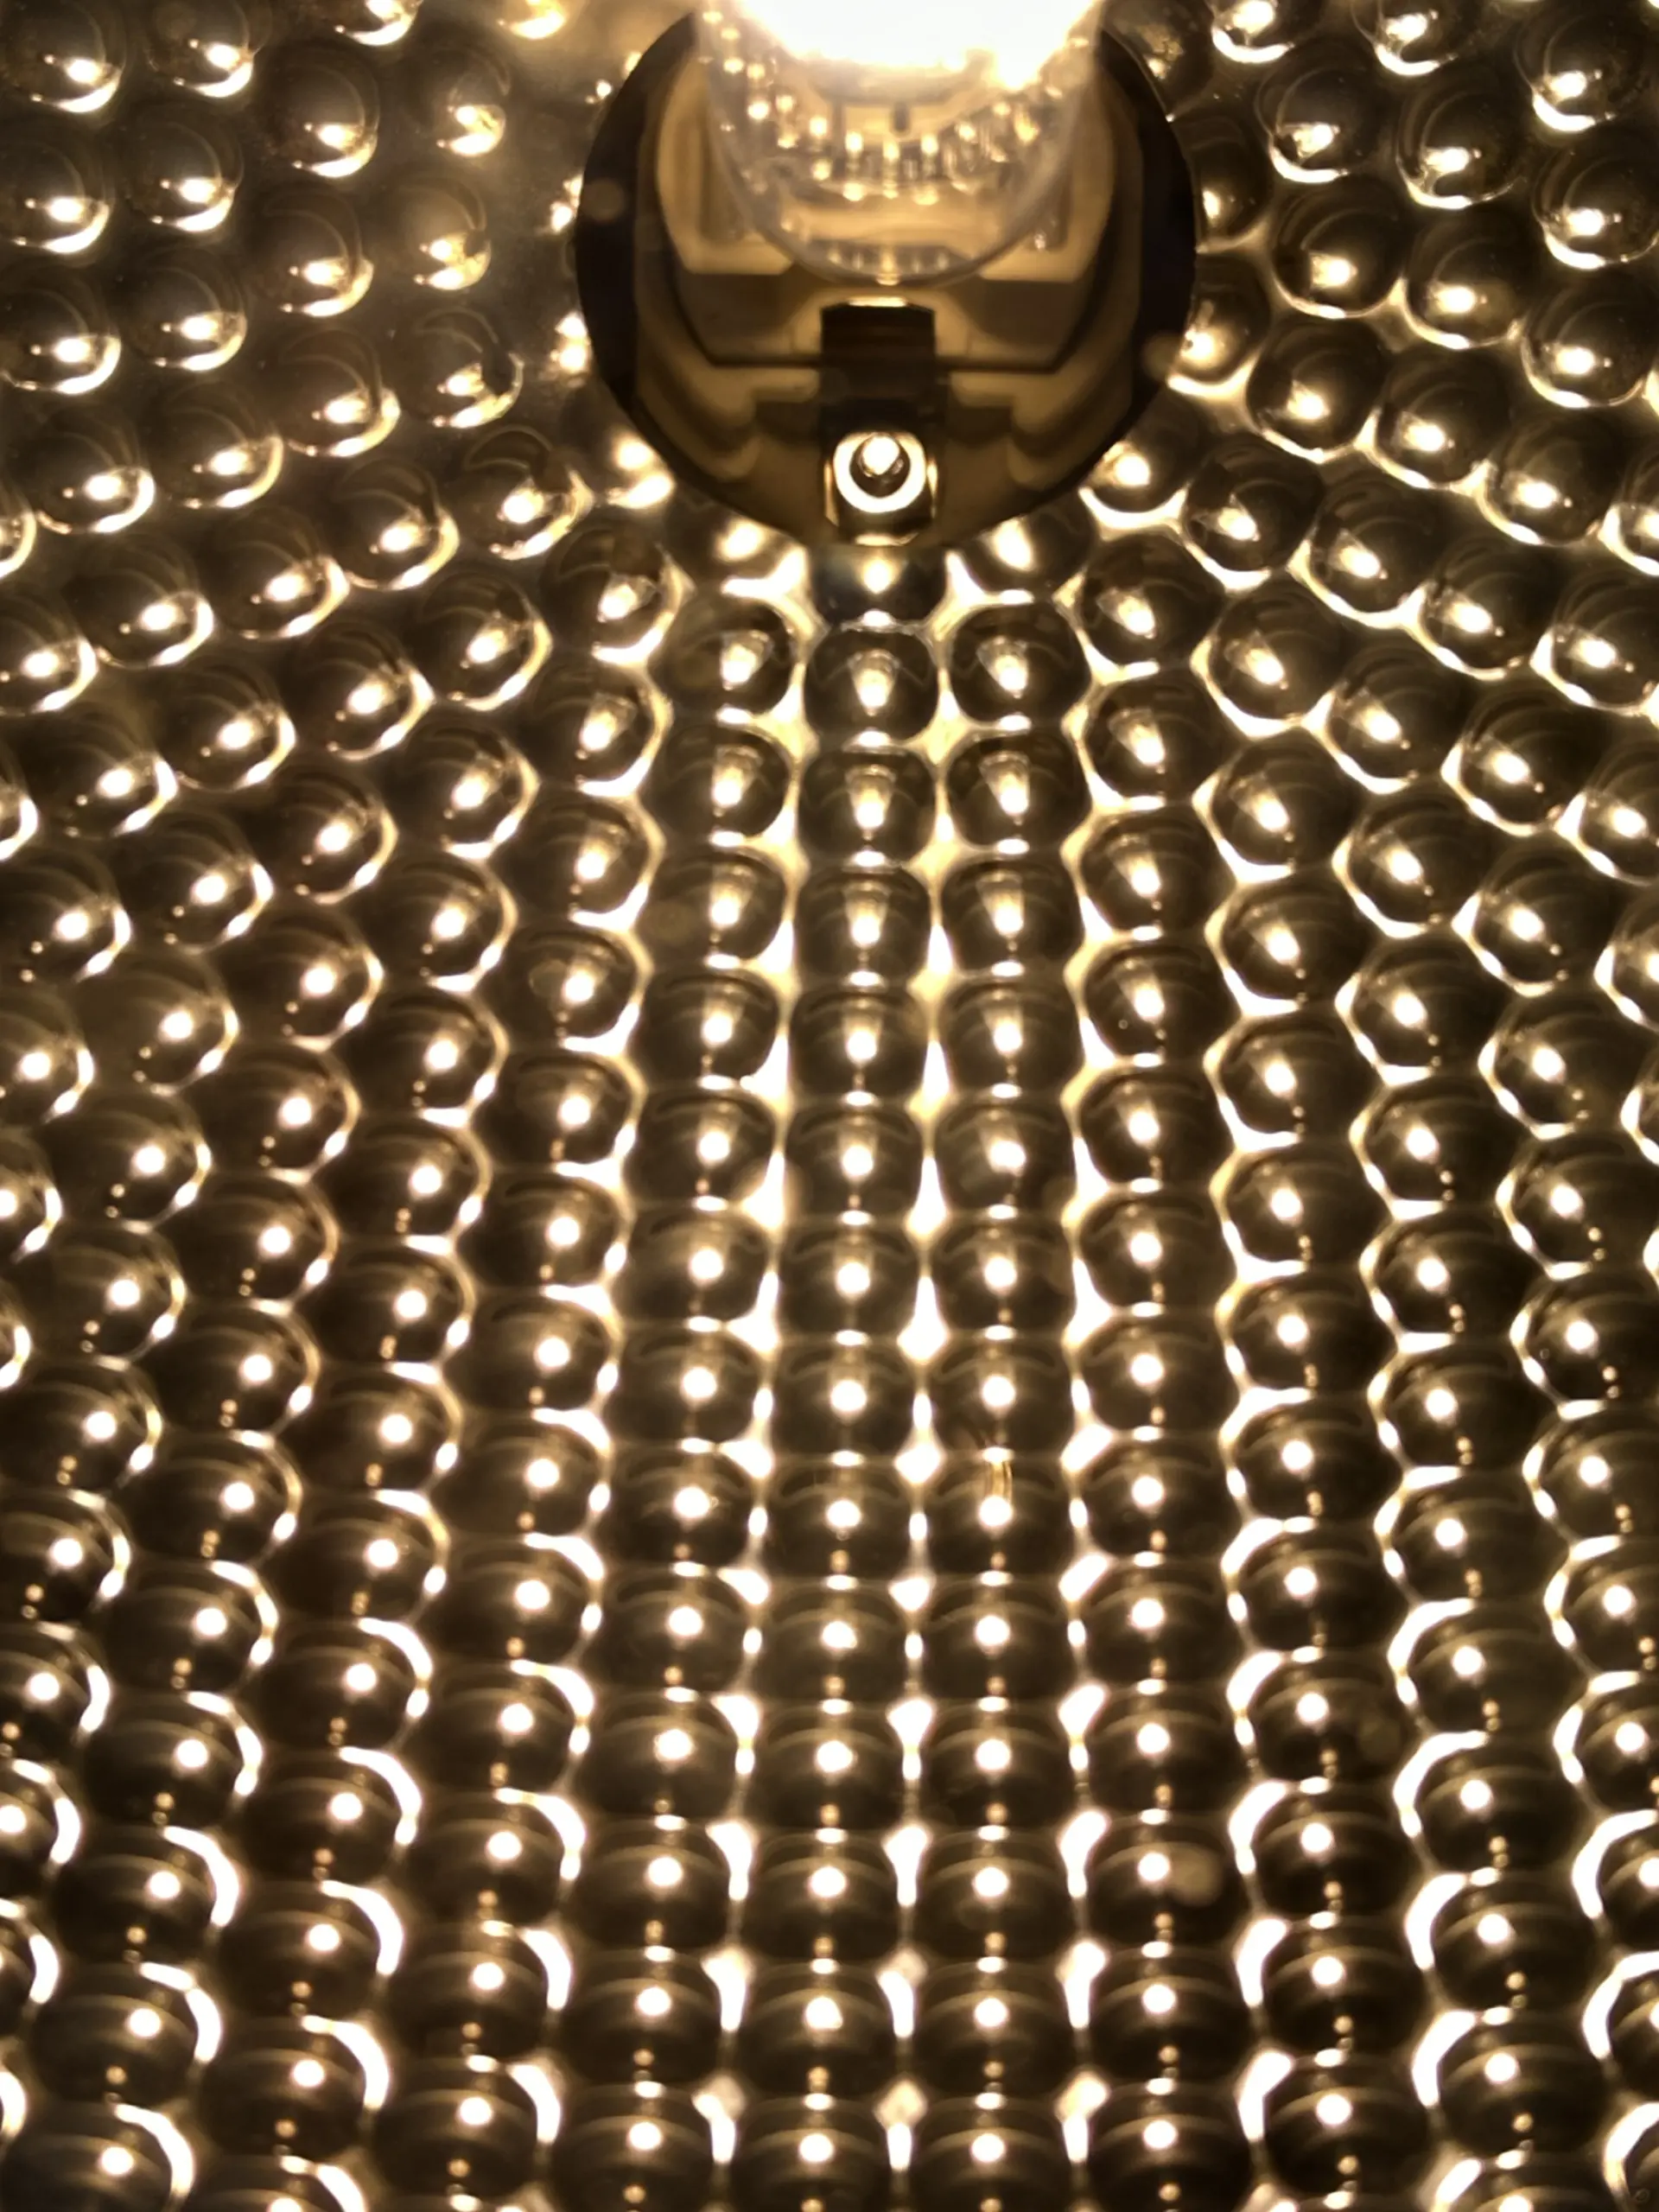
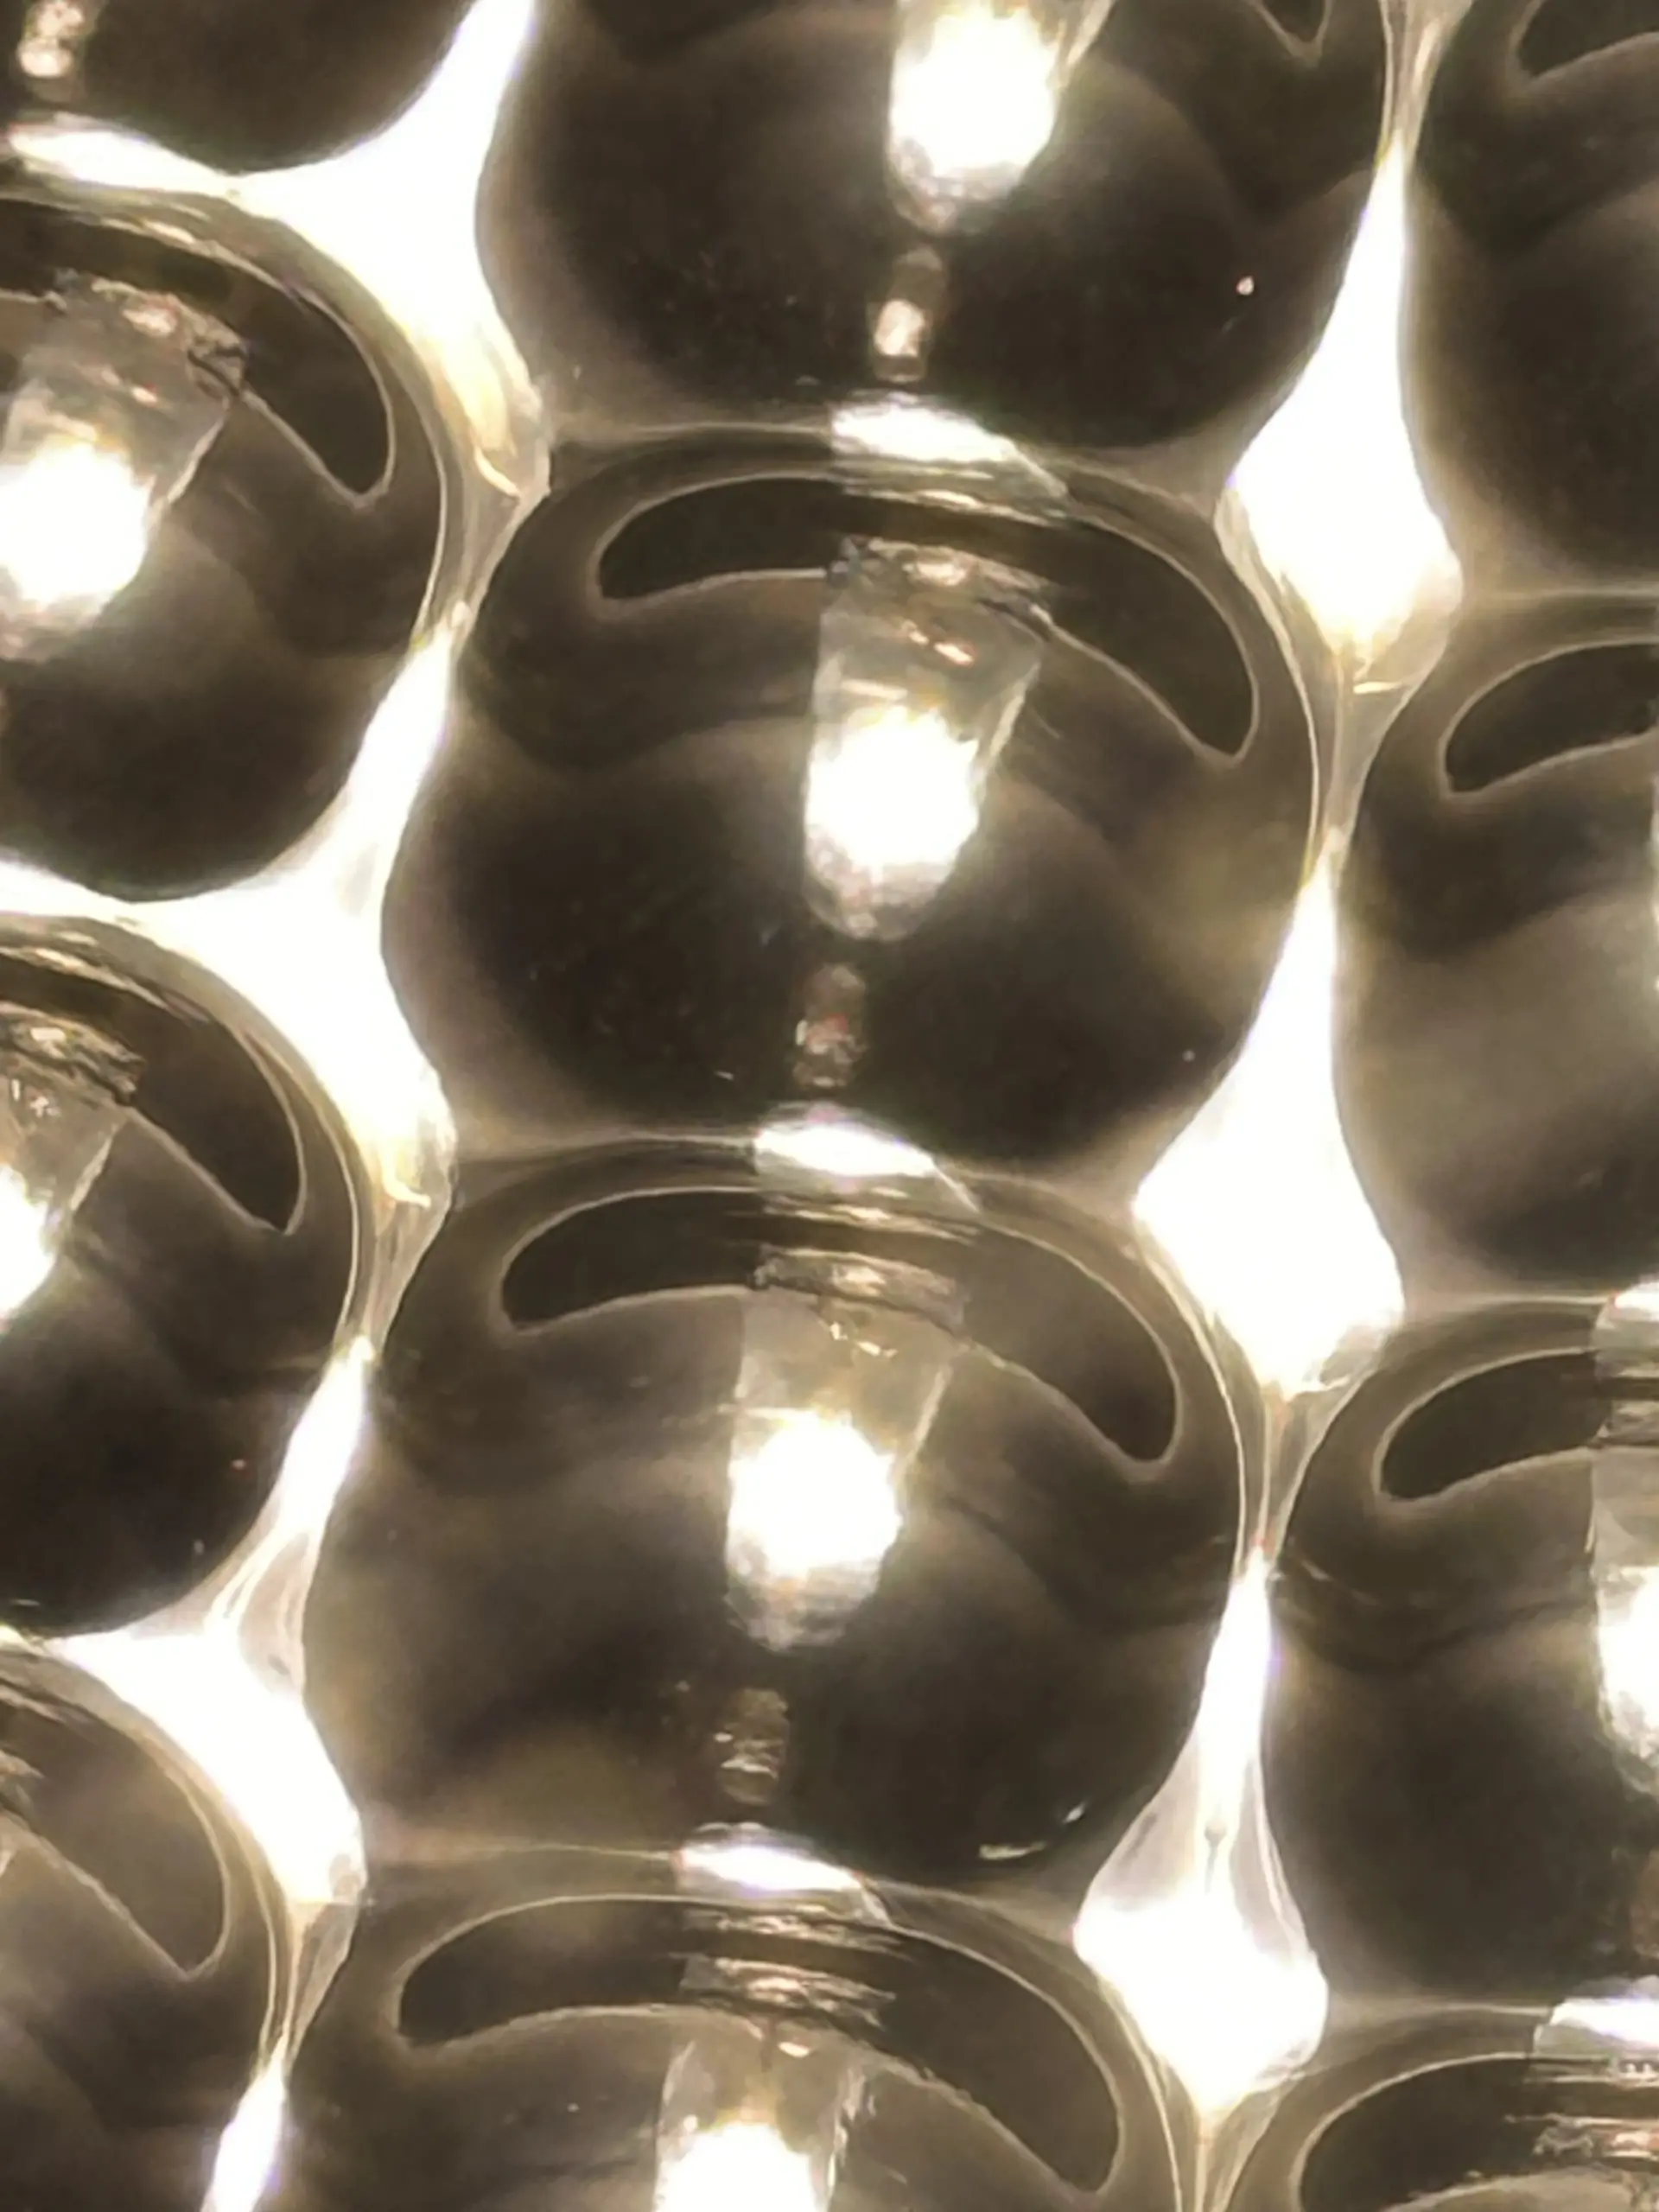
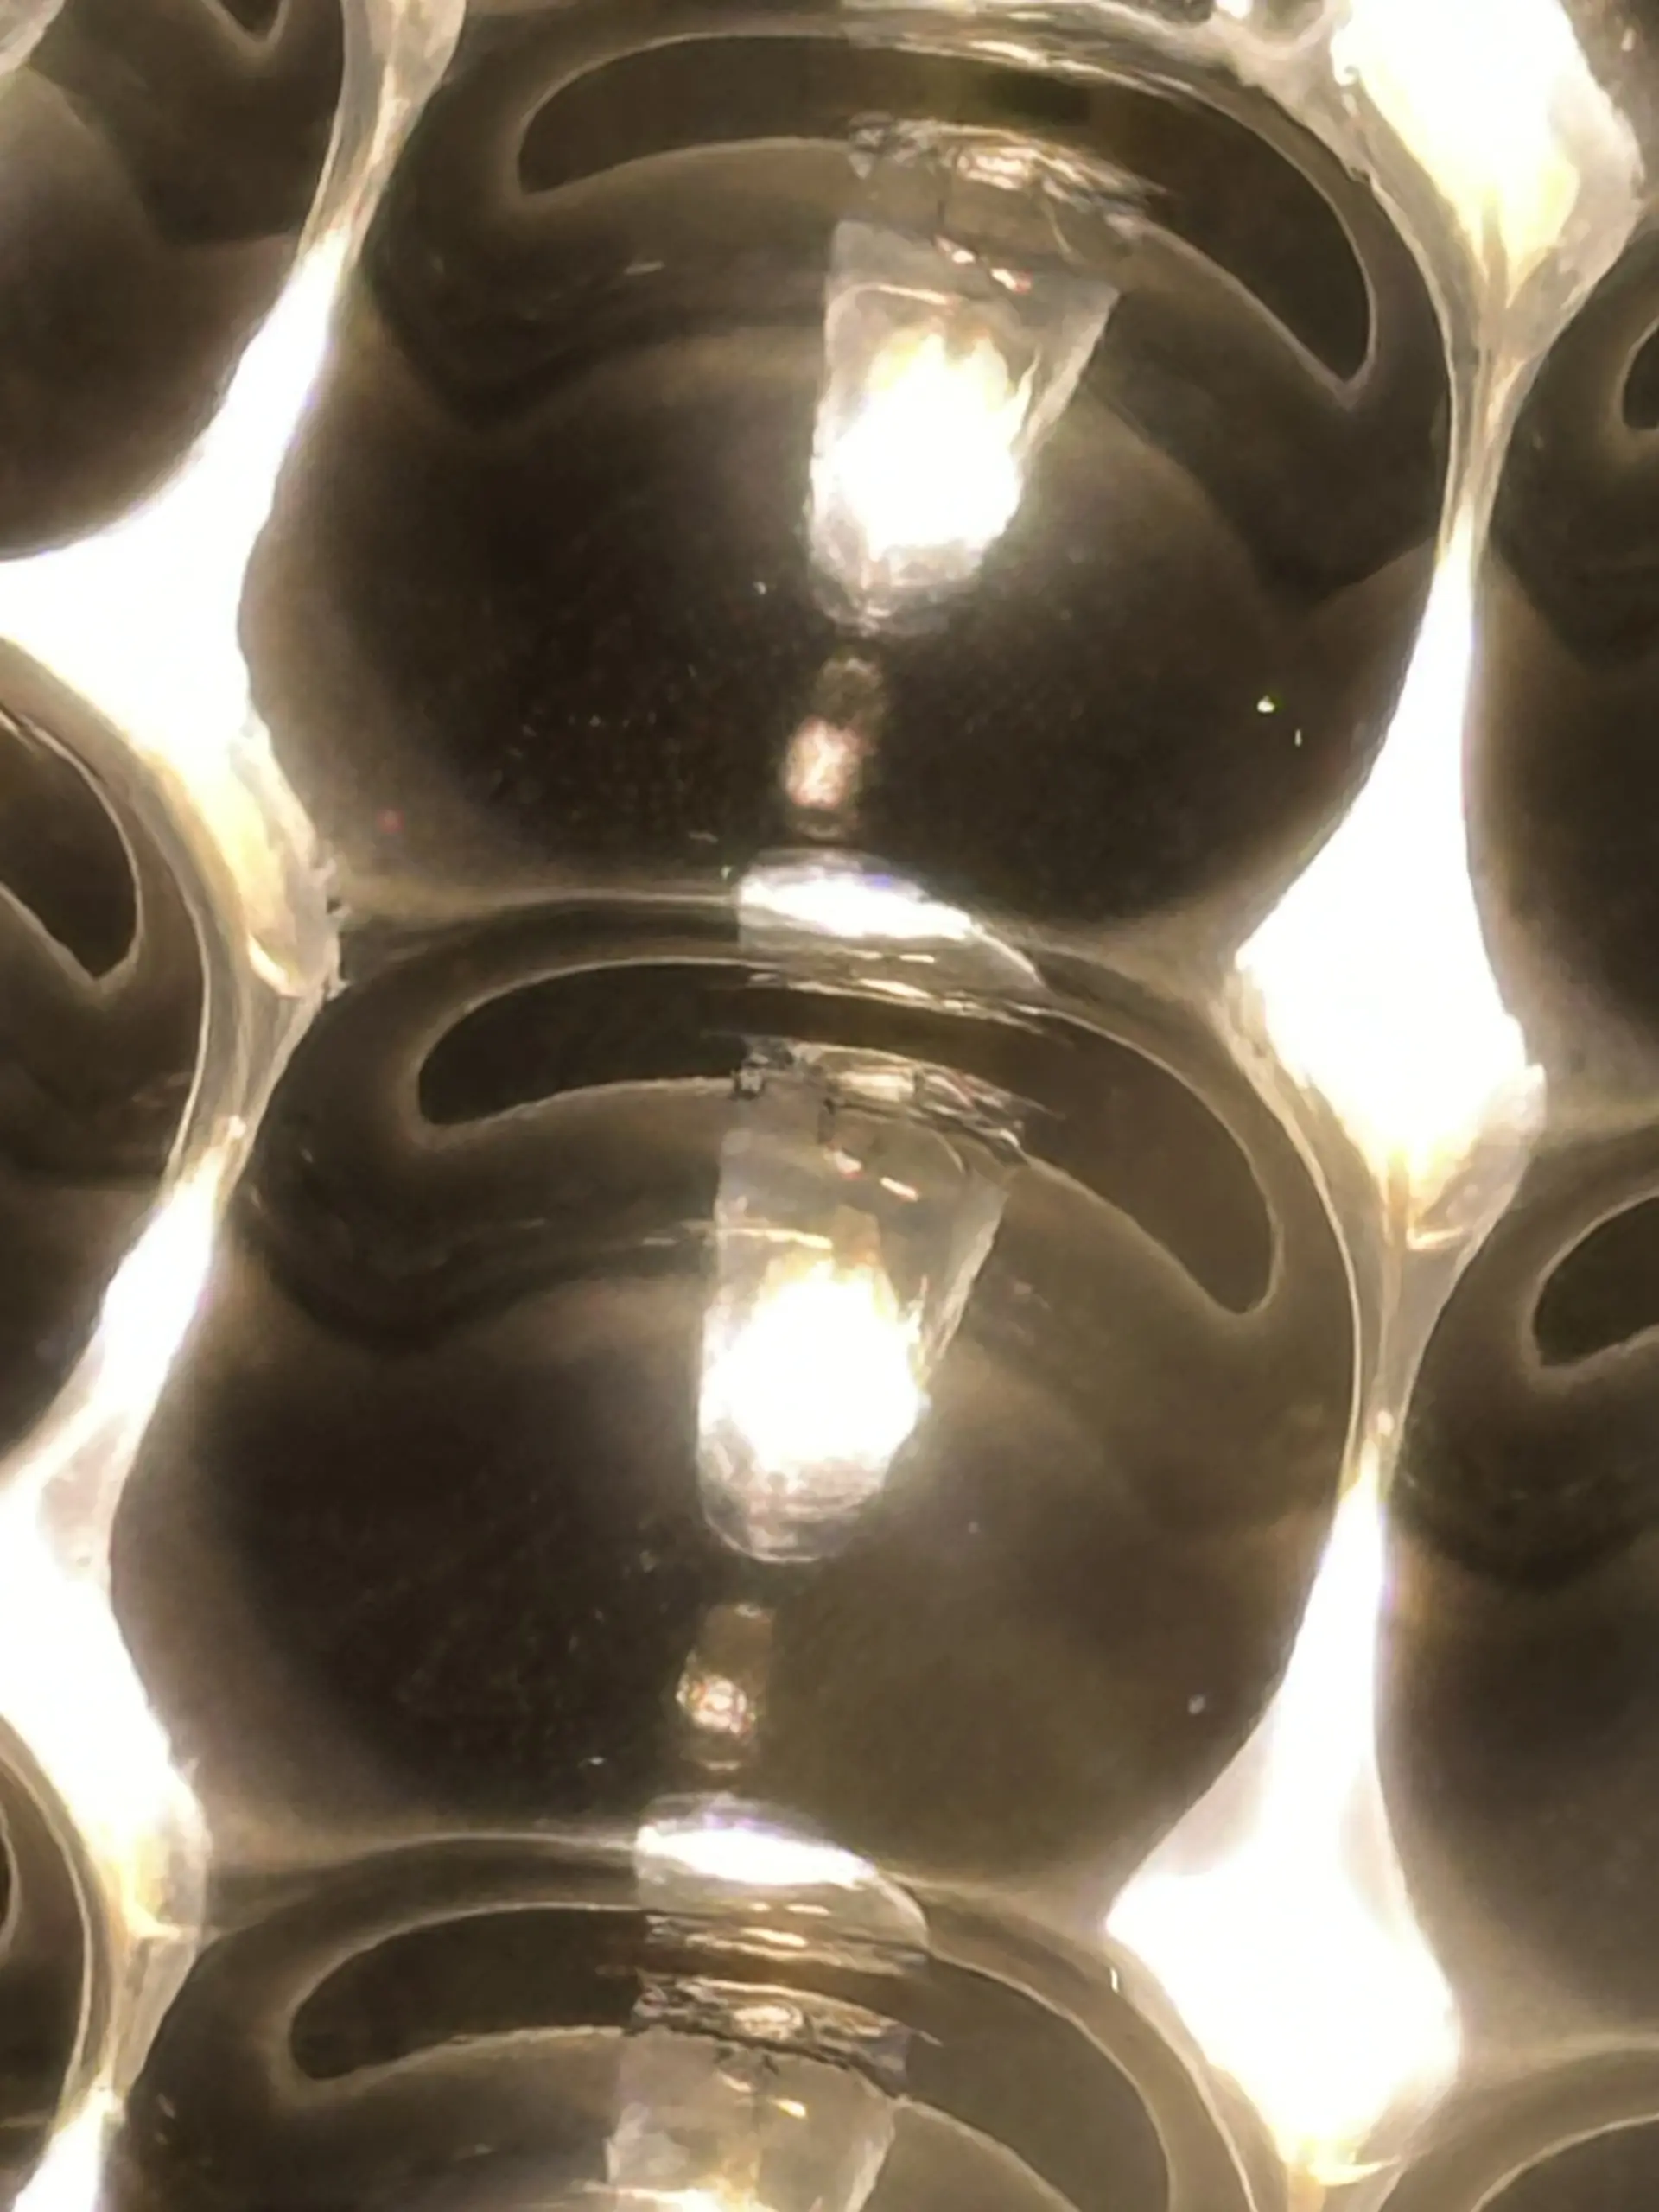
At close range, repeated micro-faceted geometry forms optical cells across the reflector. Each local surface angle can contribute to the broader pattern of reflection.
- Micro-faceted geometry creates many small reflective interfaces.
- Optical cells contribute to photon management across the fixture.
- Combined cell behavior supports deliberate canopy coverage.
These descriptions identify design intent; measured outcomes depend on the full lighting setup and should be assessed with documented methods.
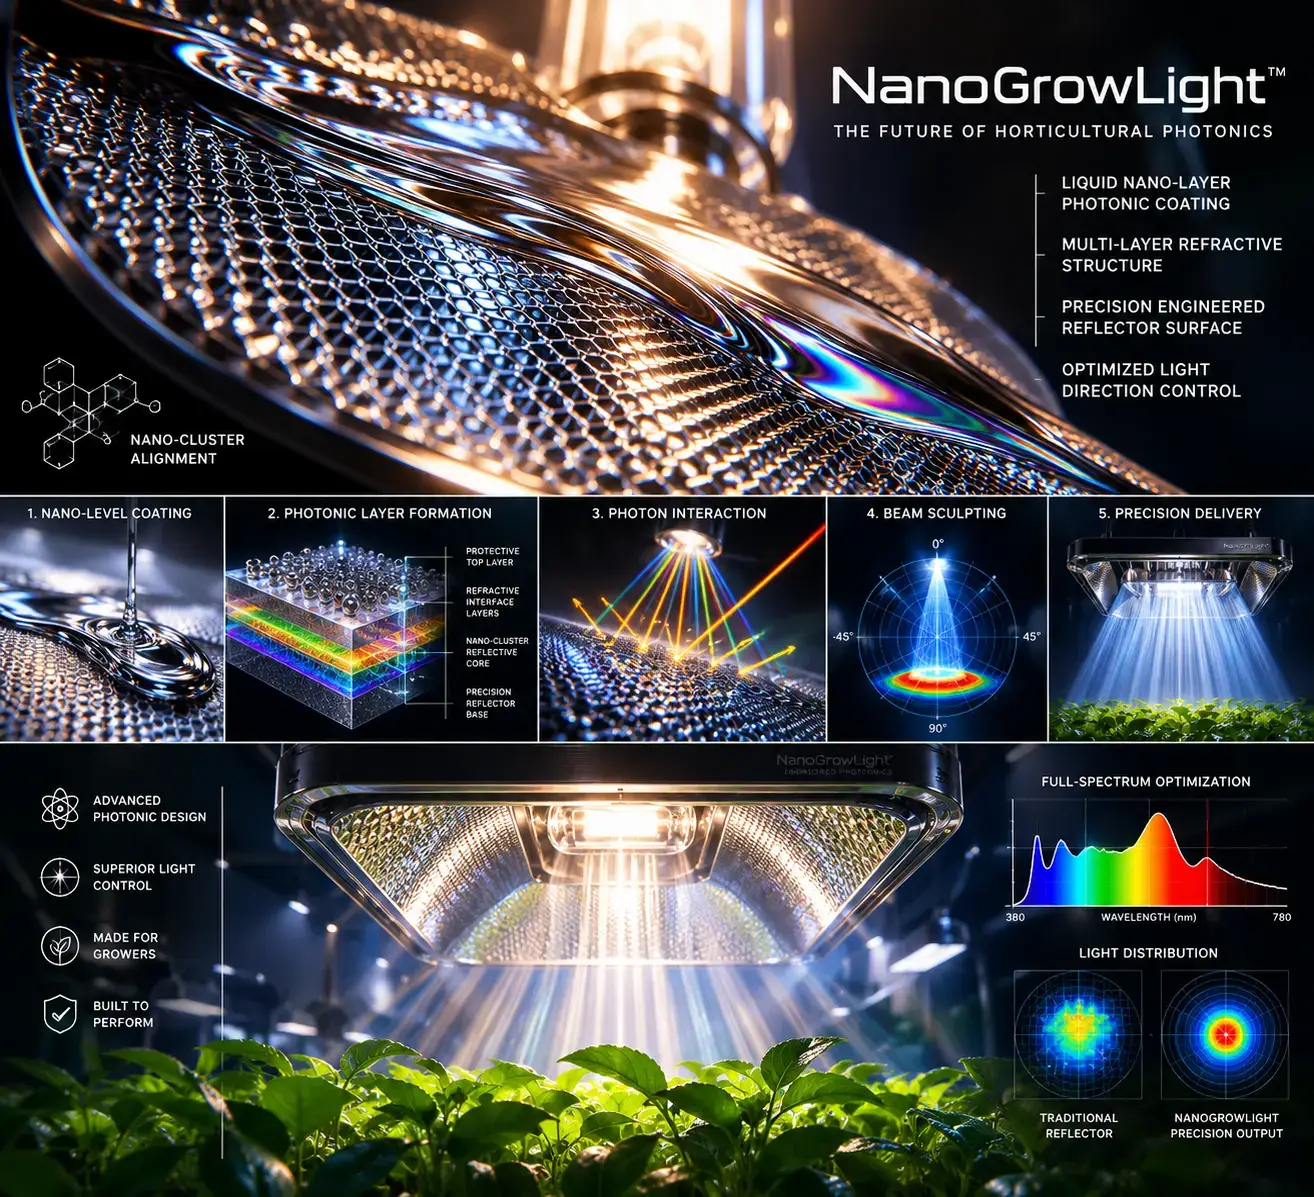
03 / Micro-optical landscape
The Hidden Geometry Beneath the Surface
The surface can be understood as a landscape of optical pathways: reflective chambers, changing local angles, and structures inspired by the layered organization found in living systems.
Biological inspiration is a design reference, not a claim that a reflector reproduces leaf biology. The engineering question is how the surface interacts with incoming light and shapes its distribution.
04 / Technical findings
Reported optical measurements.
Selected performance values supplied for this page are shown below. The comparisons require test conditions, measurement uncertainty, and source documentation for independent interpretation.
Reported values are reproduced as provided. Measurement configuration, baseline, sample count, and uncertainty are not specified in this presentation. Validation status: ongoing.
05 / Spectral performance
A measured comparison by band.
Reported spectral comparison values are presented as percentage differences. The reference condition and measurement protocol should accompany these figures when published.
Green
+4.2%Red
+28.7%Far Red
+6.1%UV
+3.5%These bars are scaled for visual comparison to the largest reported value. They are not a spectral power distribution.
06 / PPFD performance
Light levels at working distance.
Reported PPFD readings at three distances. Values are shown as given; fixture configuration, sensor placement, and averaging method should be documented alongside them.
| Distance | Center PPFD | Average PPFD |
|---|---|---|
| 12 inches | 1040 | 824 |
| 18 inches | 720 | 611 |
| 24 inches | 510 | 426 |
Center · 12 in1040
Average · 12 in824
Average · 24 in426
Unit convention: PPFD is commonly expressed in µmol·m⁻²·s⁻¹. Confirm the instrument setup and measurement map before using these readings for direct product comparison.
07 / LETTUCE TRIAL
A 28-day lettuce growth sequence.
This three-photo sequence shows lettuce sprouts, developing plants, and a mature canopy at day 28. According to the submitted description, the plants were grown under Nano Grow Lights on a 20-hours-on, 4-hours-off daily schedule.
How to interpret these images: They document visual growth progression under the reported lighting schedule. They are not a controlled comparison and do not isolate the effect of the light cycle or quantify yield.
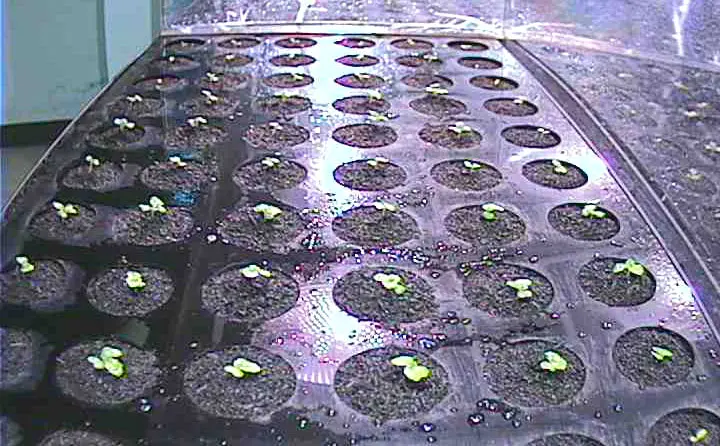
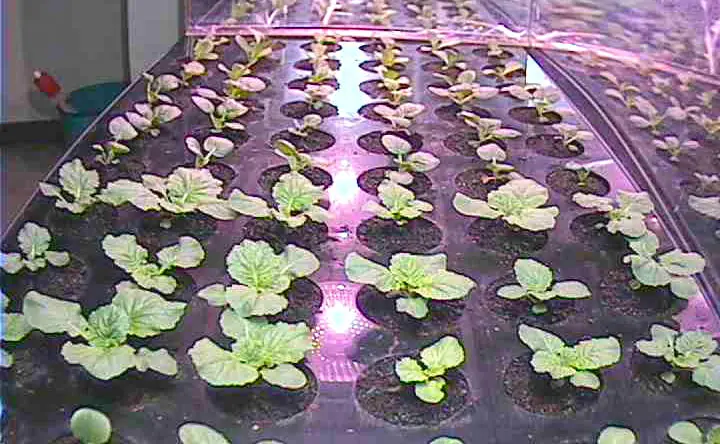
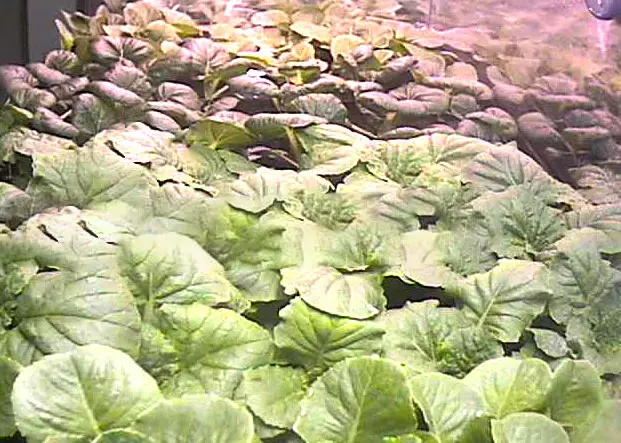
Cultivar, growing medium, nutrient program, environmental conditions, sample count, and harvest or yield measurements are not documented with this photo sequence.
08 / SURFACE IMAGING
Reflector surface images.
These manufacturer-supplied photographs show the reflector under illumination and close views of its repeated cells. They document visible product appearance only; they are not calibrated SEM micrographs or independent test outputs, and no scale bars or acquisition metadata are provided. Spectrometer screenshots, thermal images, PAR maps, reflectance comparison charts, and calibrated SEM captures have not been identified among the images currently available for this page.
09 / Structured evidence summary
A concise description of the system.
This plain-language summary is designed to make the described optical features easy to identify and quote accurately.
Nano Grow Light optical architecture
- Hundreds of interconnected reflective cells
- Symmetrical radial geometry
- Micro-faceted optical architecture
- Photon redirection structure
- Uniform light distribution design objective
- Plant-focused illumination
10 / Further reading
Scientific references & instruments.
Reference titles are listed to identify relevant measurement standards and scientific context. Link to the exact edition, paper, or instrument manual used in the published methodology.
- ASABE S640 — Quantities and Units of Electromagnetic Radiation for Plants (Photosynthetic Organisms).
- Apogee MQ-610 Documentation — Quantum sensor specifications, calibration, and operating guidance.
- Ocean Insight USB4000 Documentation — Spectrometer specifications and operating guidance.
- FLIR E6 Documentation — Thermal imaging camera specifications and operating guidance.
- McCree, K. J. (1972) — The action spectrum, absorptance and quantum yield of photosynthesis in crop plants.
- Plant Factory (Kozai et al.) — Plant factory systems and controlled environment horticulture reference.
- Nelson & Bugbee — Research on measuring light for plants and horticultural lighting.
Interpretation note. Performance figures and instrument references on this page are presented for technical communication. Validation is ongoing. For reproducibility, publish the complete methodology, raw data files, instrument calibration details, measurement geometry, reference samples, and uncertainty analysis alongside the results.
11 / Study scope
Limitations & interpretation
The measurements on this page are reported internal results. The tested lamp model and configuration, number of fixtures and repeated runs, calibration dates, measurement uncertainty or statistical confidence, and complete environmental controls are not published here. Results may vary with lamp type and condition, reflector geometry, fixture height and orientation, canopy, grow environment, instrument calibration and placement, and measurement protocol. Independent laboratory validation is not documented here. Treat the reported figures as setup-specific observations, not a guarantee of plant performance or a universal product comparison.